Forecasting Confirmed COVID-19 Cases
Beginning to track Covid-19 Cases in Colorado by County
No longer providing additional commentary, it’s too grim. But still updating these two charts: Cases per million and Total Cases
Update 10:00a March 20
Colorado has made some nice improvements and I can now recommend a visit to https://covid19.colorado.gov/data. I still think the numbers are way too low versus reality but the reporting has improved a lot. They’re reporting 277 cases as of yesterday. My model suggests the number of cases is around 700.
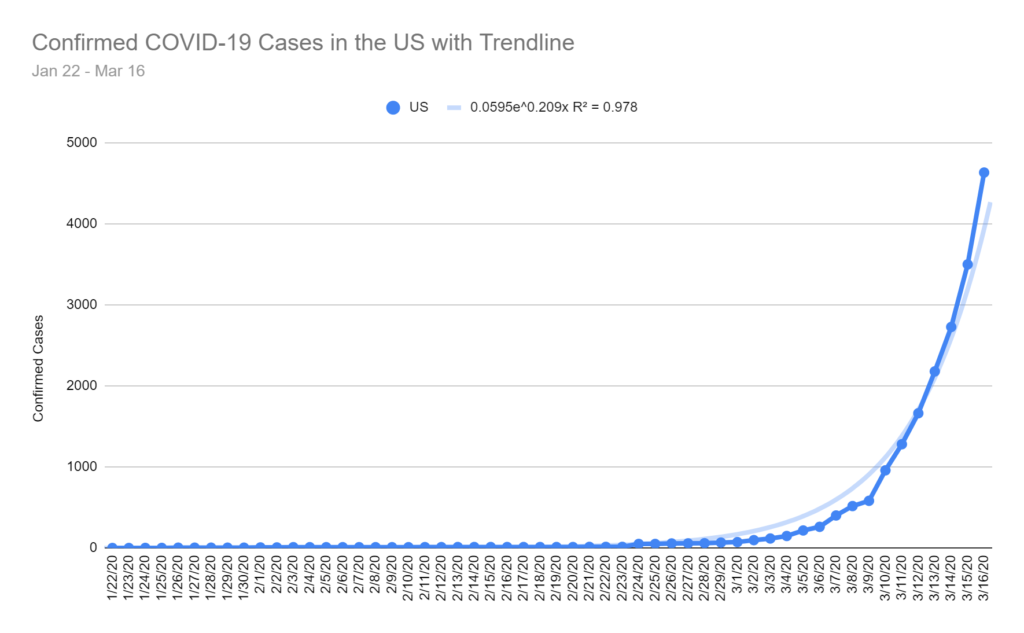
In the US, number of cases jumped to 10,442 yesterday but already this morning I’m seeing 14,250 on this JHU dashboard. This is in line with my more aggressive model prediction of 13,781 cases for today.
Update 6:38p March 18
US Cases now 7,769. My prediction for today, based on the original model, was 7,203. My original prediction for tomorrow was 8,877; my new prediction for tomorrow, including more recent figures, is 9,946. The actual number is almost certainly a lot higher.
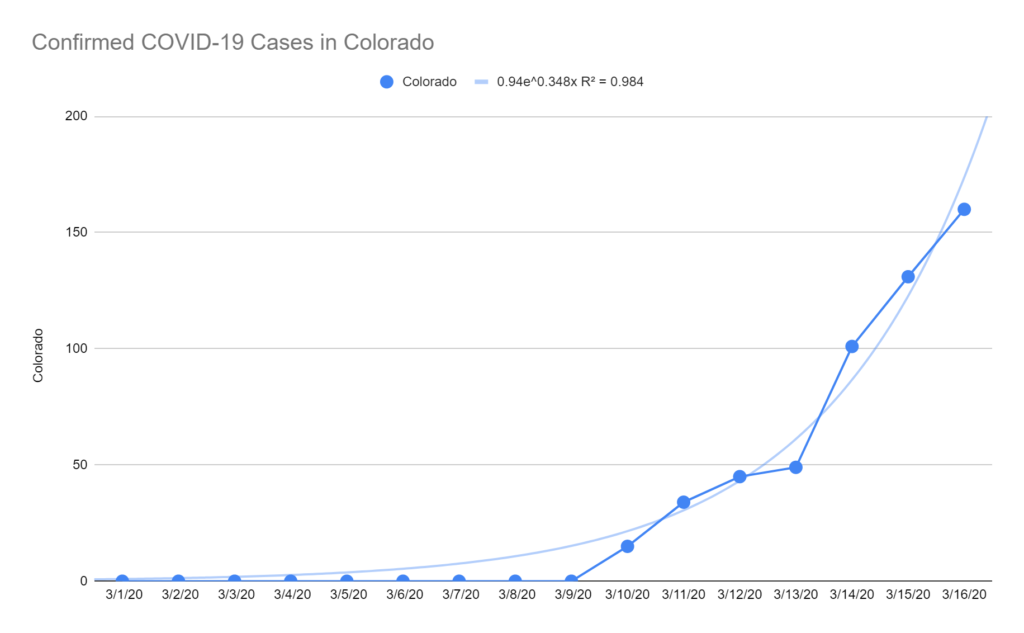
Colorado is not keeping up. They have a dedicated site at https://covid19.colorado.gov/data but total cases posted is 216, up only 32 from 184 yesterday. I think maybe they have their heads in the sand or they just have bigger fish to fry. My model suggests the current number is closer to 500 and tomorrow it should be ~700.
Update 6:25p March 17
Number of US cases is now up to 6,423 (even higher than predicted!). Colorado is not reporting a different number, they still say 160, but one news outlet reported 183. I’m pretty confident the number will go up sharply next time the Colorado Dept of Public Health posts a meaningful update.
Original article:
I’ve been downloading data from a GitHub repository maintained by the John Hopkin’s University Center for Systems Science and Engineering and I’ve decided to try forecasting the number of confirmed cases in the US and in the State of Colorado.
Here’s a link to the data and my very simplistic exponential models: COVID-19 Models
As of March 16 the US has 4,632 confirmed cases. I project the number of cases will jump to ~5,800 cases tomorrow (3/17) and ~25,200 cases in one week (3/24).
In Colorado, there are currently 160 confirmed cases. I project the number of cases will jump to ~350 cases tomorrow (3/17) and ~4,000 cases in one week (3/24).
I hope both of these forecasts turn out to be way too high. We’ll see how it goes. Hang tight, friends.
Climate Anomalies and Aftermarket Part Sales
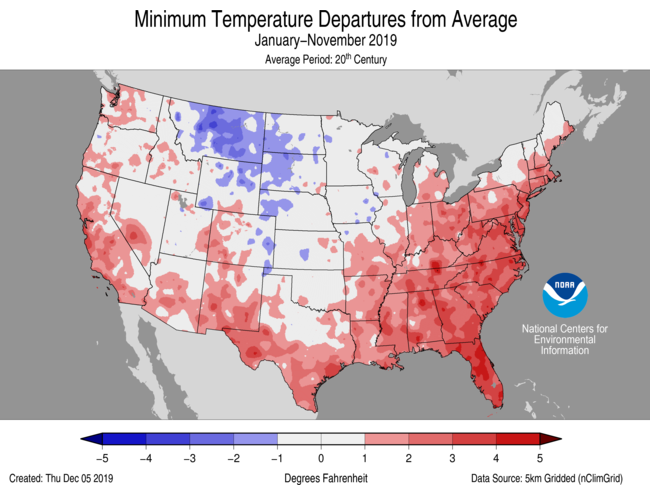
The map above shows temperature anomalies across the Conterminous US for calendar year 2019 through November. These anomalies relate specifically to daily Low temperatures. Where you see red, daily low temperatures were warmer than 20th Century averages (darker reds indicate much warmer daily low temps). Generally speaking, 2019 has been a much warmer than average (vs 20th Century) year, especially in the Eastern US and along the Pacific, Gulf and Atlantic Coasts (where the vast majority of Americans live). The Northern Rockies, Dakotas and western Great Plains areas have seen cooler temperatures but this isn’t as significant for most consumer products businesses because there aren’t as many people in the region.
Why look at daily low temperature anomalies? There could be many reasons but one reason is that some consumer products sell a lot more or a lot less depending on weather. For example, the starter motor in your car is far more likely to fail when the nightly low temperature is really low. So, companies in the automotive aftermarket are accustomed to selling lots of starters in the late fall and winter months when temperatures plummet.
But, what if they don’t plummet? Well, that might lead to lower sales volumes for the starter produce category. It might also leave a lot of starter inventory sitting on shelves at distribution centers. In other words, this can have a major impact on the starter motor supply chain. This appears to be the case in a large portion of the Eastern US where aftermarket companies may have expected lower sales due to milder overnight low temperatures.
And, that is exactly why Aftermarket Analytics is now offering a Climate Data Portal as part of our analytical services for the automotive aftermarket.
Weather and Climate Data for the Automotive Aftermarket
At Aftermarket Analytics we’ve built dozens of replacement rate models for companies in the Automotive Aftermarket. In nearly every instance we find automotive part category replacement rates are influenced heavily by geography. Typically we find vehicles driven in colder climates, like in the Upper Midwest or in New England, have higher replacement rates. The opposite is also true for some part categories vulnerable to extreme heat. As a result, we’ve spoken to a number of parts suppliers and distributors who are very interested in a better understanding of the relationship between climate and demand for replacement parts.
More recently, we’ve heard that unseasonably warm or cool weather patterns, perhaps related to climate change, are making it more difficult to accurately forecast demand for a number of key replacement part categories. In response, we are offering a new service in 2020 to help the industry address these concerns.
I’m pleased to announce that Aftermarket Analytics will begin offering a Climate Data Portal (CDP) service beginning in Q1 2020. Our CDP will provide historical and current climate and weather data, including temperature and precipitation normals along with recent daily precip and temp highs and lows for all key markets in the U.S. The portal will enable Category Management professionals and inventory managers to identify unusual weather patterns, calculate anomalies and quantify relationships between climate variables and location specific part sales. Data in the CDP will be updated on an ongoing basis and will be easy to manipulate, visualize and download for further analysis.
Contact me for more details!
Technology Jobs in Pueblo
Earlier this week I attended a Pueblo City Council working session where I urged City Council to do more for technology companies. My presentation was covered by the Pueblo Chieftain in an article by Ryan Severance. I read it online yesterday and was surprised to see the article on the front page of today’s paper, above the fold no less!
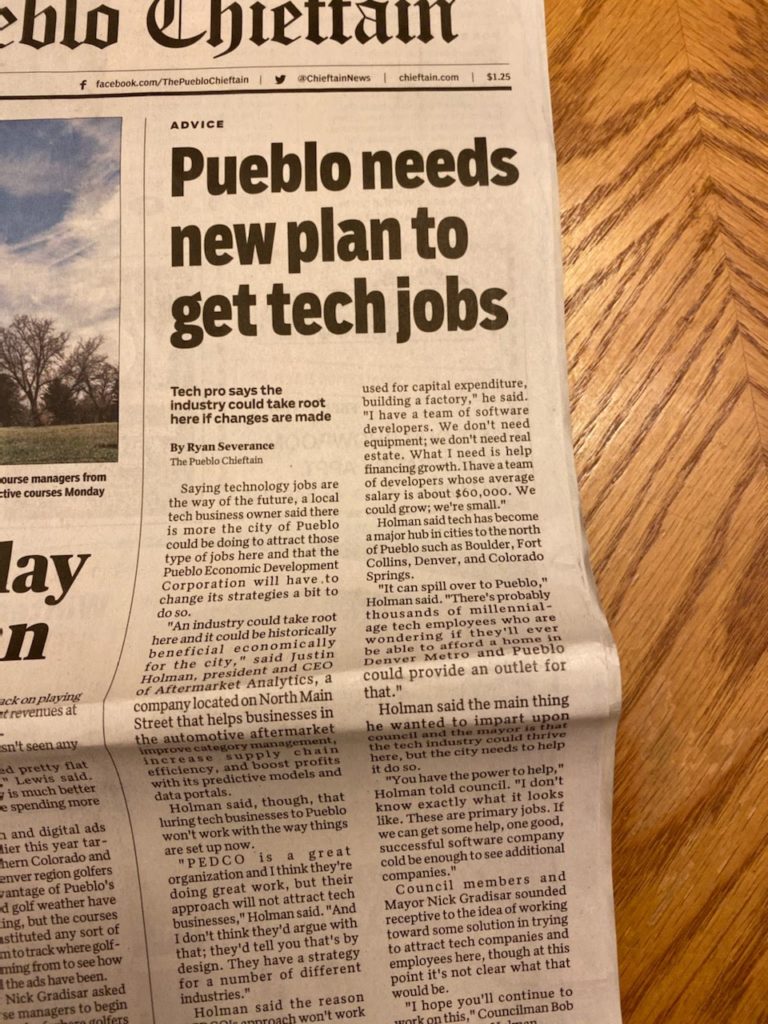
Pretty cool. Thank you Ryan Severance for covering the City Council meeting!
I do want to clarify what I meant in a couple of the quotes. And I’m not suggesting I was misquoted. I think Ryan Severance did a great job summarizing. I just know what I intended to say, even though I probably wasn’t as articulate as I’d like to have been. The first quote states, “An industry could take root here and it could be historically beneficial economically for the city,”. I would change just one word here from “historically” to “extraordinarily”, meaning if we establish a local software/technology ecosystem it could be extraordinarily beneficial to the local economy. The next quote I want to clarify reads, “If you want a deal with PEDCO, the money has to be used for capital expenditure, building a factory,” I meant to say, “like building a factory”. The CapEx emphasis makes sense for manufacturing and some other industries but doesn’t help a software company much at all. Finally, my last quote states, “If we can get some help, one good, successful software company cold be enough to see additional companies.” I intended to say that one successful software company “could be enough to seed additional companies.”
I know, these are very minor differences, I just feel better explaining what I meant to say.
I will indeed keep working on this for Aftermarket Analytics and for Pueblo. Hopefully we can find a way to attract technology businesses and help them thrive in Pueblo.
Update: The Pueblo Chieftain editorial board wrote an opinion piece about my presentation to City Council. Also, I’ve heard from a few who cannot access the article on the Chieftain website so I’m posting PDF versions here (see download links below).
Forecasting the Future of the Automotive Aftermarket with New Car Sales Data
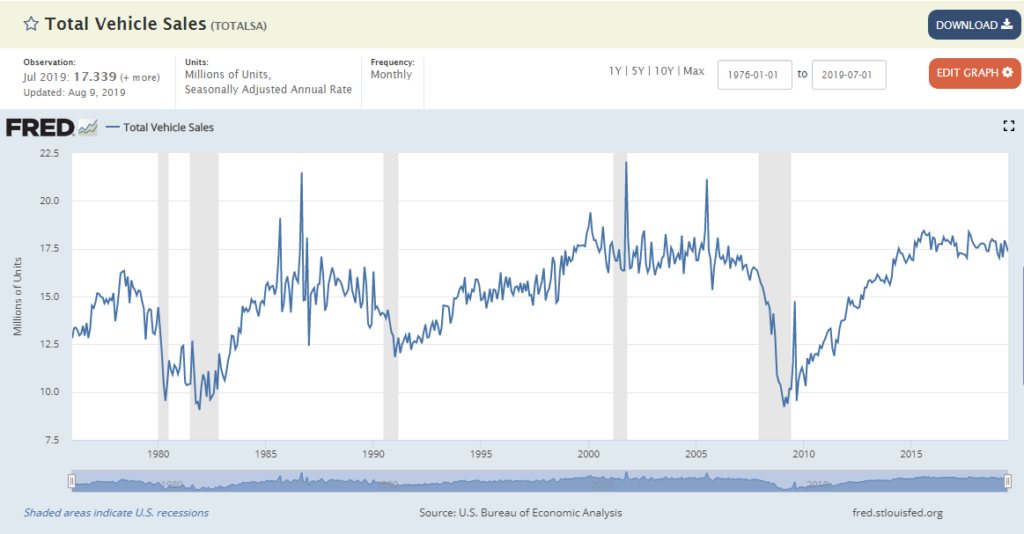
This line chart (from the St. Louis Fed website) is one I’ve looked at many times. It tells an interesting story.
It shows monthly new car sales volume in the US going all the back to Jan 1976. Along the horizontal x-axis we have the monthly time series beginning Jan 1976 on the left moving through time until the present with last month’s car sales on the far right. Along the vertical y-axis we see new car sales volume in millions. In Jan 1976 the annual rate of new car sales, seasonally adjusted, was approximately 12.8 million. More generally, car makers were selling about 14-15 million units annually during the late 1970s. Last month, Jul 2019, the seasonally adjusted annual rate was approximately 17.3 million units, which is about where it’s been for the past 5 years. It’s been a roller coaster ride but for the domestic automotive industry volume is only up 15-20% over more than 40 years. Thankfully for the industry global growth has more than made up for relatively stagnant domestic sales.
The line chart includes shaded areas corresponding to economic recessions. You can see the dual stagflation recessions in 1980 and 1981-1982. You can see the recession in the early 1990s coming on the heels of the S&L Crisis. You can see the 2001 recession following the bursting of the Tech Bubble and you can see the recent Great Recession of 2008-2009 following the collapse of the housing and mortgage markets. Obviously, recessions aren’t great for new car sales. Usually, sales volumes decrease; sometimes they drop precipitously. It’s hard to miss the way new car sales fell off a cliff in 2009.
How is this relevant a decade later? In the Automotive Aftermarket it’s extraordinarily relevant because the “sweet spot” for automotive parts suppliers, distributors and retailers is about 10 years, more or less depending on the part category. So, while most of the economy has moved past the calamity of 2008-2009 recession, the Aftermarket is still dealing with the fallout. On the flip side, during the next decade the US aftermarket industry should experience growth mirroring the upward slope we see between 2010 and 2014. For investors or entrepreneurs looking for a silver lining in recent market volatility and increasing fears of a recession, the automotive aftermarket could provide a nice counter-cyclical investment opportunity.
Cyber Security Workshop Presentation
I’m presenting a brief lecture today at a Cyber Security Workshop in Colorado Springs.
My presentation slides: Visualizing Cyber Security Data
Sample Resources:
- Analytics Justin Holman Pages 20190101-20190228
- Threat Intelligence-2018 IBM X-Force
- Staying Safe Online
- The 2018 Cost of a Data Breach Study by Ponemon
Issues:
- Use of color
- Data density
- Pie charts
- Bubble charts
- Map projections
- make your own maps @ https://www.mapbox.com/
-
The Future of VIO
I just published a blog post about the future of VIO data (VIO stands for Vehicles In Operation; think census of registered cars, SUVs, light trucks, etc) over at aftermarketanalytics.com.
Here’s a link to the post: https://aftermarketanalytics.com/2018/05/15/the-future-of-vio/
Please take a look if you’re interested and share!
Introducing “Inventory Analyst” by Aftermarket Analytics
In the past year, Aftermarket Analytics has been working hard to bring a new product to the Automotive Aftermarket. The new product, Inventory Analyst (IA), is a web service or software-as-a-service (SaaS) designed to provide an easy-to-use solution for part-level demand forecasting. Rather than trying to explain what that means I want to share with you a new video we’ve produced to demonstrate how the software works and how easy it is to use. This is less of an advertisement and more of an instructional/educational introduction to the software.
The video was produced by our new Director of Sales & Marketing, David Taylor. Take it away, David!
There will be more videos to come, so stay tuned.
I want to add that I couldn’t be more proud of my small team who made this happen. Shout out to Chris Harman who leads software development and Bobby Valentine who leads data science. I couldn’t hope for two better technology gurus and team leaders. Their overlapping teams include Michael DeGraw, Brian Hicks, Christian Bundy, Sean Fitzgerald, Yassin Bahid, Alex Marck and, before her recent retirement, Nancy Hamilton. I also want to thank David Taylor for leading our sales and marketing efforts (his work is just beginning) and Nicole Heyn who keeps all the administrative pieces of the puzzle together. Thank you all!
For several years we’ve been operating successfully as a custom software development and analytics solution provider. This represents our first effort to bring an industry solution to market so we need all the help, good vibes, karma and feedback we can get. If you have any feedback on this video, the software or how we might reach as many potential users as possible, please leave a comment here (or send me a private note using the Contact form below). If you know someone in the automotive world, especially in the automotive aftermarket, please share this with them so we can continue to learn, improve and provide extraordinary value.
Our mission is to build world-class software to help companies in the automotive aftermarket deploy inventory as efficiently as possible. In doing so, we hope to also make a very small dent in the aggregate consumption of energy and materials and take a very small step toward building a more sustainable economy.
Oh yeah, we also want to build a great company and create excellent jobs in our hometown of Pueblo, Colorado. We’re always looking for great people to join our team. Let me know if you think you might be able to help.
Pueblo 5-year Report Card
In 2012, I wrote a post about my reasons for moving to Pueblo, Colorado. After approximately 5 years, 120,000 page views and 500 comments, it’s time for a report card to see how things have worked out.
Real Estate: A
One of the primary reasons for returning to my home town was to invest in Pueblo real estate. In 2010 you could drive around most parts of Pueblo and see obviously distressed properties on nearly every block. Foreclosures were almost the entirety of the market and buyers were few and far between. Now we have a seller’s market with insufficient inventory driving prices higher. Although Pueblo real estate is still very affordable compared to anywhere north along the Front Range, it’s no longer easy to find bargains, at least in residential property. And, due to the lengthy post-2008 construction slump, the supply-demand imbalance seems likely to persist and support steady or higher housing prices near term. Pretty solid turn-around, not unlike many parts of the country, but I think Pueblo’s prospects remain very strong thanks to population growth trends we’re seeing throughout Colorado.
If you’re a lifelong Pueblo native it may be difficult to imagine but a population wave is coming to Southern Colorado. It’s already hit Denver Metro expanding north and south, mostly along I-25, leaving high housing costs and traffic in its wake. The same wave that has filled in open spaces from Fort Collins to Colorado Springs will continue to move south, albeit at a slower pace. Pueblo is already seeing population growth and a lot more will come as high-flying housing prices and crushing traffic in Denver continue to push some residents to relocate. This wave of people seeking the good life in Colorado will generate demand for housing and Pueblo’s economy stands to benefit substantially. This also makes the next decade an important time for Pueblo to get its ducks in a row.
Climate: A
I love Pueblo’s mild, sunny, four-season climate. Think Albuquerque rather than Denver. Summers definitely feel hotter than they were in the 80s but winters are milder too. In the past year, I played golf on Thanksgiving and New Years Day. My style of golf involves no gear except for an 8-iron and a golf ball and I usually only play 3-4 holes, but still, we’re talking year round access to the great Colorado outdoors. The sunshine is particularly valuable as solar becomes a more viable and inexpensive source of energy. We installed rooftop solar in 2015 and it’s been a terrific investment, despite our fox-guarding-the-hen-house situation with Black Hills Energy. Thanks to bountiful solar radiation in Pueblo we produce more than enough electricity for our own needs plus we’re paid for net production. Life is good when Black Hills pays you and not the other way around.
Crime: B
The top concern I hear from prospective Pueblo residents is crime. If you read the comments on my original Why Pueblo post you’ll see many are wary of finding themselves in a dangerous neighborhood. I did a deep dive on crime data this past fall to counter dishonest claims made by the Pueblo Chieftain Editorial Board and a band of like-minded partisans who called themselves Citizens for a Healthy Pueblo (now they call themselves ProPueblo but they should consider renaming themselves Pro-Status-Quo-Pueblo because their primary objective is to keep Pueblo the way it is, complete with vision-free community leadership and a stagnant economy). Despite their efforts to use scare tactics and anecdote to tie marijuana legalization to increased criminal activity, it just ain’t so. They also blame marijuana on the increase in homeless population but they don’t have a shred of proof, nor any meaningful understanding of statistical correlation.
Perhaps because many among them have ties to local hospitals they remain unwilling to acknowledge their own role in creating the real drug problem infecting our community: the Opioid Epidemic. I think a serious effort to understand the true cause of criminal behavior in Pueblo would show a strong connection to opioid and heroin traffic and abuse. Prove me wrong ProPueblo!
K-12 Education: D
The biggest disappointment to me in Pueblo is the sorry state of primary education. The problem is partly driven by national politicized anti-education forces but Pueblo seems to be doing a particularly poor job of defending and nourishing its public schools. There are certainly bright spots in District 60 and District 70 (see my analysis for 3rd Grade, 7th Grade and 10th Grade math performance) and I know families whose children are thriving in Pueblo schools but, overall, Pueblo is failing to provide an adequate primary education system. There are several reasons Pueblo schools are struggling.
Failure of Local Leadership – a few years ago District 60 hired Constance Jones as Superintendent and, from my vantage point, she was doing the right things to improve Pueblo schools. But the D60 school board inexplicably forced her out. I don’t really know the reasoning and it doesn’t seem anyone else in the community really knows either. Check the Pueblo Pulp for an excellent series of articles on the fiasco. I think it comes down to a systemic problem in just about every facet of business in Pueblo. There is a circle-the-wagons mentality. We desperately need outside expertise for Pueblo to grow and prosper but the powers that be in Pueblo prefer to repel the same experts who are in the best position to help the community. I’ve seen this through the lens of a few personal friends who came to Pueblo to run an organization or a department or a business and were essentially forced out because they were too aggressive about pursuing best practices and doing what’s right for their organization. Sadly, small-mindedness runs rampant in Pueblo and holds the community back from reaching its full potential.
Inadequate Private School Options – Pueblo doesn’t have a single private high school. This is really a major problem. Families need options. I suspect both Parkview and St. Mary Corwin have a very difficult time convincing top medical talent to move to Pueblo and I am willing to wager that a top concern is inadequate educational opportunities for children. Private schools in Colorado Springs, including Fountain Valley School, the Colorado Springs School and St. Mary’s Academy, are all enrolling Pueblo students to fill the gap. I’ve heard St. Therese (in Pueblo) has some sort of high school option but my impression is that you can count the number of students enrolled on one hand. It’s also obvious to me that Pueblo needs at least one private school on the north side of the city. All current private school options I’m aware of are south of the Arkansas river while the vast majority of recent residential growth is on the north side of the city. Here’s an idea – use some of the Pedco money to provide a grant for a non-profit to start a private school in the vacant Somerlid Elementary campus on West Street between 27th and 28th. Personally, I favor Montessori methods but any non-sectarian approach will do. I’m willing to bet the 5-year ROI (if it could be accurately measured) would outshine Pewag, Vesta, and any other Pedco-sponsored employer in terms of net positive economic impact.
Political Collateral Damage – just like everywhere in the US, public schools and teacher unions are under attack. In the current anti-civilization political climate championed by the GOP, public schools and public educators are systematically denigrated. In a country where Betsy DeVos is Education Secretary it’s difficult to see how public schools will recover near term. If anything this situation is worse in Pueblo thanks to biased reporting by the Pueblo Chieftain. As if being a teacher answering to demanding parents, administrators and students wasn’t difficult enough they must also deal with the politics of education policy. No wonder so few talented people are pursuing teaching careers.
Sprawl – as people continue to move from within Pueblo city limits to Pueblo West, Blende/Avondale, Beulah, Rye and elsewhere, the tax base for D60 continues to decline. This is a self-reinforcing downward spiral. I’ve written about the problem with sprawl in Pueblo West elsewhere and it’s part of the reason I advocate a toll booth between Pueblo and Pueblo West to counteract the sprawl-induced economic damage. I’m not the only one with this point of view. Joe Minicozzi, an urban planning expert who spoke at a recent Colorado Downtown Inc conference in Pueblo, had this quote published in the Chieftain:
On a per-acre basis, Pueblo West’s high infrastructure costs and relatively low property valuations and tax contributions hurt the economic health of the entire Pueblo area, particularly the city of Pueblo, he said. “It’s just going to drag the whole county down in the process,” said Minicozzi, known nationally for his work on analyzing the economic impact of land use.
Overall: B
Overall, I’ve loved living in Pueblo. I wish I could issue an A grade. It’s my home town and I feel very comfortable investing in Pueblo despite all these challenges. And, I’ll continue to be in Pueblo as I run a technology business with an office in downtown Pueblo, I teach Statistics in the Hasan School of Business at CSU-Pueblo and I own rental properties in Pueblo. But, primarily due to personal struggles with the education system in Pueblo (and we bear as much responsibility for mistakes as any school or district – it’s no picnic advocating for the educational needs of individual children these days), our kids are attending school in Colorado Springs and have been for the past 3 years. As a result my wife and kids’ social circle is in Colorado Springs. And, to make life more convenient for my wife and kids, we have recently relocated to Colorado Springs.
I suppose this will be good fodder for those who want to poke fun at my original blog post and subsequent comments promoting Pueblo. Ha ha, Mr. Pueblo moved to Springs! Have fun with that. But, at the end of the day, I’m not married to Pueblo, I’m married to my beautiful, amazing wife and committed to doing what’s best for our family. So, I’ll be commuting from southwest Colorado Springs for the foreseeable future. And I’m willing to pay a toll for the privilege of doing business in the great city of Pueblo … so long as Pueblo West residents are paying the same toll.
By the way, our house in Pueblo is for sale. Make me an offer and you too can get paid by Black Hills. 